Cryptocurrency exchange
Cryptocurrency exchange (or Crypto exchange) is a place where people are able to exchange cryptocurrency for others or for main national currencies (dollar, euro, yen etc.) It is a secondary place to earn them after mining and, currently, primary to spend.
- Category: Exchanges
Contents
What is cryptocurrency exchange?
Thanks to the high volatility of cryptocurrency most people use them to speculate in different exchanges. For instance, over the last year Bitcoin has rosen around 785% in value. This particular quality of cryptocurrencies is what attracts a lot of major investors. For instace, the Winklevoss brothers invested $11 million in Bitcoin in April 2013 and in the end of the same year the Andreessen Horowitz venture fund along with some other investors have invested a record $25 million in the cryptocurrency thanks to the Coinbase wallet system.
Types of cryptocurrency exchanges
Exchanges can be divided into two types:
- Those that exchange bitcoins and some primary forks for fiat money (USD, EUR, GBP). This is the case for most major exchanges.
- Those where it is only possible to exchange using just cryptocurrencies. Fork trading happens here.
Some forks can only be sold/exchanged in particular exchanges and stored in particular types of wallets.
Adding new coins to exchange
When new fork is created it is added to exchanges through voting that takes place on exchanges’ blogs of forums. This is also one way to perform an ICO
An example of voting on adding Corgicoin to several major exchanges:
Cryptocurrency exchange rates
Exchanges with fiat currencies
- Bitfinex, currently the biggest one with 16% market share in the industry.
- BitFlyer is the biggest one in Japan and second one in the world with 15% market share.
- Kraken, third in place with 10% of the market share.
- OKCoin, based in Hong-Kong, this exchange house is fourth in place with 9% of the market share.
Mt.Gox: Brief Description on its Rise and Fall
Mt. Gox is the very first cryptocurrency exchange, which was established in 2007. In the beginning it was trading Magic the Gathering game cards from which time comes the name: Magic The Gathering Online eXchange. During August 2013th about 47% of all transactions in the Bitcoin network were made through this site. Throughout January 2014th the exchange was third largest stock exchange in terms of trading extent and the Bitcoin exchange rate was significantly higher than in other similar exchanges due to delays in withdrawing funds in dollars, a fact that made U.S. authorities to look into the matter.
In late February 2014th the exchange was closed because of a security breach in their system, that caused a considerable amount of bitcoins to go lost – the sum was estimated to be around 850,000 BTC an equivalent of more than $450 million US dollars at the time.
Cryptocurrency trading platforms
Here are the exchanges that support trading only between cryptocurrencies. The main cryptocurrencies that are exchanged for all others are Bitcoin, Litecoin and Primecoin.
- – Primary cryptocurrencies exchange for Bitcoin, Ethereum, Litecoin and USDT. Constantly updating Trading Pairs and listing the best projects. Regular promotions and giveaways.
- BTER – the main feature of this exchange is a large choice of forks that can be traded for national currency (CNY) and other cryptocurrencies. Trading is conducted in pairs with BTC, LTC and CNY. The average bid/buy order of popular forks is ~1.5 BTC.
- HitBTC – world’s most advanced cryptocurrency exchange. Since 2013, HitBTC has been providing markets for Bitcoin, Ethereum, Litecoin, Dogecoin, Monero, USDT, and more than 300 cryptocurrencies in total.
- – here different forks can be exchanged for primary cryptocurrencies: BTC, LTC and DOGE. Some cryptocurrencies are traded here exclusively. Average order is ~1.5 BTC.
- Nominex – new trading platform for convenient trading. Average order is <1 BTC.
- Poloniex – trading in pairs with BTC and LTC. There are some exclusive cryptocurrencies. Average order is <1 BTC.
- Prandex – India’s first international cryptocurrency exchange. Prandex have 50 major coins/tokens and more than 100 trading pairs listed in Bitcoin (BTC), Ethereum (ETH) and USDT markets.
- MintPal – major amount of trading is conducted in pairs with Bitcoin. Only Mintcoin is traded for LTC. There are several exclusive cryptocurrencies. Average bid/buy order for popular forks is <1 BTC although there are occasional rate shocks for different pairs with average orders rising up to 3-4 BTC.
- – wide choice of trading pairs with BTC, LTC and DOGE. Average order for popular forks is <1 BTC.
- McxNOW – primary cryptocurrencies exchange for Bitcoin. Average order is <1 BTC.
- CoinField – Canada’s largest bitcoin & cryptocurrency exchange registered with Fintrac. Average order is ~1.5 BTC.
- Blockchain App Factory – White label exchange platform for Bitcoin, Bitcoin Cash, Ethereum, Ripple, Litecoin.
Principles of trading in cryptocurrency exchanges
Main principles of trading and speculation on cryptocurrencies and stock markets are similar (buy low, sell high). Therefore to achieve some success in this sphere people should first have to study basics of stock exchange trading (trading with stocks, futures, options etc.).
Main information components of exchanges
When entering any exchange site one can spot several principal components:
- Chart
- Buy / Sell orders
- History of transactions
- Trading volume (shown in some exchanges)
Exchange Charts
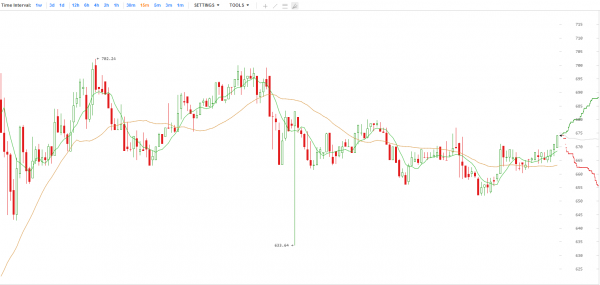
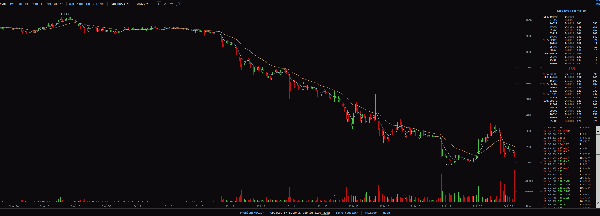
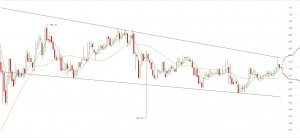
The chart shows changes in cryptocurrency rate over time. In essence, the chart is a graphic representation of spread changes. Spread is a difference between prices on ask and bid orders at the same point of time.
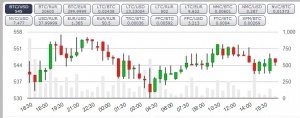
The chart itself is usually presented in the form of Japanese candlesticks.
Japanese candlestick is a way of representing the price movement over certain period of time. Candlesticks provide useful information about market trend or possible changes in said trend by presenting price movement in a special graphical manner.
One candlestick represents price movement (up or down) during a certain period of time (which can be adjusted in certain exchanges) that is usually 10, 15 or 30 minutes. Hence to form one candlestick requires 10, 15 or 30 minutes. Then the next candlestick begins forming, and so on.
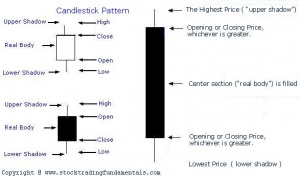
Japanese candlestick consists of several components:
- Candlestick body. The wide part of the candlestick is called the body and it represents the range between opening and closing prices of trading for a certain period of time. If the body is black (or red) that means that closing price was lower than opening price and the candlestick in that case is called bearish (i.e. demonstrates the price falling). If the body is white (or green) then the closing price was higher than opening price and the candlestick is called bullish (i.e. shows the price rising).
- The lines above and below the candle’s body are called its shadows. They represent the highest and lowest prices during a certain period of time. If a candlestick doesn’t have upper shadow they say that it has its top cut. If there’s no lower shadow than its base is cut. Japanese candlesticks with small body sizes and long shadows are called Spinning Tops. The ones without a real body (closing price is equal or almost equal to opening price) are called Doji.
Buy/sell orders
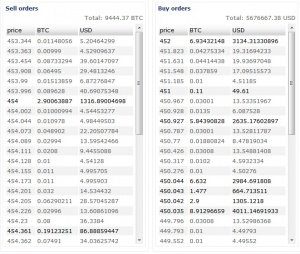
These are tables that show the nearest buyers and sellers. They are called order books. Only declared offers to buy/sell which can work out if someone decides to buy/sell at that price are displayed here. The table is divided into three columns: the current price at which the currency is being bought or sold, the amount of bitcoins that are being bought or sold and its equivalent price in dollars.
The order book is formed as follows: to make a deal in the exchange one has to file an order through the form of purchase/sale where primary parameters of the upcoming bargain will be listed: price and amount. After the order is received by the exchange for processing the search for an opposite order begins and if such an order is found the transaction is made (for example, if you’re selling, there are purchase orders with equal or higher price searched for). If an opposite order isn’t found, your order gets listed in the order book separately (if no one else wants to buy/sell at your price) or together with an order with the same price.
Orders table analysis
By using the orders table one can calculate the spread of particular cryptocurrency.
The image demonstrates an order book in the BTC-E exchange and the spread here is equal to 453.344 – 452 = 1.344 USD.
It is the order book where you can get information about major players’ orders from and they can be used to make trading decisions. But one shouldn’t forget that not all orders are listed here, only the closest ones to market rate can be found.
Traders have to watch for major orders (ones for bigger sums compared to the current trend) because they greatly influence the rate movement. If a large purchase order is listed close to market rate than there’s rate growth possible and vice-versa, a large sell order may cause a rate fall.
Passive and aggressive orders
- Passive orders are the ones that are statically located at prices close to each other, i.e. they don’t move and sort of guard a certain level without showing any aggression. Order book shows passive orders at the moments when market approaches strong graphical level of resistance (or support). As a result of market struggle that level will either be breached or bounced off from.
- Aggressive orders are the ones that are conducted momentarily, i.e. the purchase or selling is made at existing price and the larger the order the higher (when buying) or lower (when selling) will the rate go.
Levels of support or resistance. These are the lines that are drafted on the chart at price maximums and minimums.
Level of support is a line drafted at the bottom at price minimums. This level is created by large purchase orders at these prices. If the exchange rate drops, i.e. large selling orders are carried through than as soon as the price drops down to the level of buying a large order, this order is carried through in full or in part (depending on the amount of people that are ready to offer their money in exchange for a commodity/cryptocurrency) thus raising the rate. At a new height the sellers will sell the commodity or cryptocurrency again and the rate will fall yet again to the level of a major purchase order. So it will go up until nearest large orders completely run out and the support level will be breached and the rate will fall to the next major order.
Resistance level is opposite to the support level in direction but is the same in essence: so long as the price is rising, purchase orders exceed the selling orders but when the price reaches the level at which a major purchase order is listed the price falls down. The level may be breached if a large purchase order will exceed the selling order.
Trend is a direction of the described levels (left to right). Rising if it goes up and downtrend if it goes down.
History of transactions
Shows particular buyers/sellers and the prices and amounts they are trading at. History of transactions can be used to conclude trading volume.
Trading volume analysis
This parameter is represented as some figure expressed in currency or securities that demonstrates the magnitude of all deals struck during a certain period of time. Analysis of this data is spread into three directions: analysis of vertical volume (volume based on price), horizontal volume (volume based on time), and cluster analysis. Vertical volume is preferred as an analysis tool in exchange markets.
Vertical volume is data about the number transactions conducted during a specified period of time, represented in the chart as columns. For example, if a chart is measured in hours, then each column will reflect the amount of bitcoins (or other exchange instrument) that were exchanged from owner to owner during one hour. By analyzing vertical volume one can determine the players’ interest towards one price level or another.
Users must always remember that the market does not rise because more bitcoins are bought than sold, nor does it fall because more bitcoins are sold than bought. The market movement depends on aggression directed one way or another. If the market is dominated by aggressive buyers that don’t care for the purchase price they will list orders that will be carried through instantly at the current prices. Such orders tend to be listed by more emotional players while professional prefer to work with limit orders (setting their own price based on market analysis).
Key points during vertical volume analysis there are climax buying or selling points during which the trading volume indicator can rise 5 to 10 times compared to the average volume. In cases when the volume climax arises in the same direction as current trend it says more about the strength of the current trend and this point should not be used as a signal to enter the position.
If culminating volume appears in corrective direction in regard to long-run trends, the probability of correction ending with further return to previous course increases. It is during such situations one should look for a point to enter the market.
Special properties of cryptocurrency exchanges
The Cryptocurrency market is different from stock exchanges in such regard that volatility (rate shocks) of cryptocurrencies is significantly higher than that of stocks, futures, or even fiat money. As it was already pointed out during 2013, the Bitcoin exchange rate has risen by ~5500%. Stock exchange fluctuations are hundreds times less significant. To make considerable profits in stock exchanges one has to invest considerable sums of money. Cryptocurrency exchanges allow for earning significant profits while investing much less money: the exchange rate sometimes fluctuates so widely that $5000 can be turned into $30,000-$40,000 in just a couple of days. The same though, happens the other way around; prices might also drop significantly in just a matter of hours or days.
Technical analysis of crypto exchanges
With regard to the approach which is used to predict the movement of the course in the stock market, half the people believe that it does not apply to the cryptocurrencies market because the “nature” of crypto-economy is somewhat different to that of traditional markets. On the other hand, other believe that such an approach can also be used in the cryptocurrency market.
The main work to be done when predicting the exchange rate in the stock market is to follow the news regarding those key points that matter: reputation of the companies, actions performed by these companies, their future plans, relevant people working on them, etc. These are some of the factors that affect on the price of the share (if its the stock market) or a given cryptocurrency (if this one is backed up by a product, if not its volatility will only depend on buy and sell behavior of participants). For crypto, such news may be found in Telegram group chats and channels, dedicated forums, news webpages, Reddit, Steemit, and Medium.
Advice from your friends at Bitcoinwiki.org
- Don’t be greedy. Don’t wait for rates to grow even higher if they’ve already grown fairly enough because you can miss out on your profit, i.e. you shouldn’t set your selling price too high if the currency is actively bought at a slightly lower one – the players may not comply with yours.
- Be patient. When you buy at some price and don’t notice any significant fluctuation you shouldn’t sell too fast. There were a lot of examples of a smooth rate skyrocketing up tenfold a week or two later. You have to monitor newsfeed and users’ comments on that coin.
- Always look at the order book. If there are few buyers and a lot of sellers, then selling after buying might be hard, it depends on the cryptocurrency in question.
- Check the trading volume and currency’s capitalization to know if you should wait sharp swings soon.
- Read the news constantly!
Monitoring and analysis of digital currency exchange
Services that help tracking trading volumes (amount of $ involved in buying/selling), rates fluctuation, price of cryptocurrency in different exchanges as well as their return.
- Coinmarketcap – demonstrates total capitalization of different cryptocurrencies, current price (in $), amount of coins in circulation, trading volume in last 24 hours, price growth in last 24 hours, trading volume chart. Info from this site can also be implemented as a widget through an API into other places, as shown at the top of this article.
- Bitcoinwisdom – a detailed chart that demonstrates Bitcoin trading volume and rates in 3 main exchanges in real time. There are tools for chart tuning and technical analysis.
- CoinWarz – detailed information for different cryptocurrencies: mining difficulty, multiple exchanges rates, trading volumes, general info on the coins, an option of viewing difficulty and price in the form of charts, a mining calculator.
